Build your own “data warehouse” for reporting purposes in a multi-services environment
This blogpost was originally posted on the Fretlink Tech blog while I was working there in march 2021
Tech companies nowadays swear by data-driven decisions. It can be good for specific business KPIs, however, if taken too far it can lead to incorrect optimisations (too local), social pressure on your employees, incorrect business decisions, metrics with no meaning.
Having sharp insights into your business and your technological resources is important, don't get me wrong. But we will try to show in this article what pitfalls to be aware of when going towards the “data everywhere” mantra. And also how we transformed our way of dealing with data at Fretlink in the past 2 years.
Disclaimer: this blog post presents our approach and solutions considering we have “reasonably big data” (as opposed to “big data”) with our biggest tables containing between a few million rows (106) and a few hundred million rows (108).
Caution: Don't try this at home
When the team was small and had to grow fast, no one in the tech team took the time to build, or even think of, a data processing platform. Spoiler: it was not our best move.
The company needed to export some data for our clients: we offered plain spreadsheet exports.
Internally we wanted to measure our quality of service: we added more columns to our spreadsheet exports.
The finance team needed pricing data for accounting: we offered a slightly different spreadsheet export (which contained mostly the same data…).
Our supply team on the road to meet our carrier partners wanted to offer them data insights: we offered even more columns to our spreadsheet exports.
Our different teams started to build analysis with those spreadsheets but it very often led to inconsistent results, or different computation logics: we offered a self-hosted Tableau© server to gather analysis in a “central” point.
We've now split our main monolith into 4 independent services with their own databases: let's create an issue to keep track of what we need to build: a “reporting” API, in the future, when we have time.
Ok stop. What happened there?
- We had lots of data, but none of it was reliable, traceable (which interfaces produced that data?), nor of good quality.
- Every team had their own computation methods, their own metrics, it became hard to reason on the same things internally.
- Tableau© was a saviour \o/… No. It was not. It's pretty heavy (in resources), data preparation is done offline (with Tableau Prep), it doesn't magically solve the “bad data / data source” problem, it's really expensive, …
High quality data with PostgreSQL
Control the exposed reporting data
First of all focusing on the quality of your data is key. So let's try to answer the following question:
How do you achieve quality data, traceability, and governance?
Luckily we were already focused on splitting our monolith app into multiple dedicated services for both technological reasons and for better isolated software responsibilities. By doing so we also made sure to use the robust RDBMS solution PostgreSQL for each new service. Exposing all data for each service to our Reporting machinery was clearly not an option:
- because the internals of our software can sometimes become complex and that complexity doesn't need to be absorbed by our data team (of course sometimes it does and you will have to expose most of the original data model but it needs to be thought of carefully).
- also we wanted to give developers the control over which data they expose to the company with a relatively simple solution that doesn't rely on the service codebase.
- Overall, it's not because you have many data that you need to produce analytics or reportings on every single stored column.
We decided to take advantage of SQL Views (In SQL, a view is a virtual table based on the result-set of an SQL statement) and the namespacing feature of SQL Schemas in PostgreSQL. We thus agreed that each service should:
- create a dedicated
reportingschema to hold any reporting data. - create SQL views in the
reportingschema to expose virtual tables based on the data of the service.
For instance, our service dedicated to carriers could have a database layout defined like this:

Meaning we will only expose a name, a city and a capacity number in a virtual table carrier in the reporting schema even though we have much more information internally in the service itself. This becomes very handy because we build a concrete mapping between our service internals and the exposed reporting data. It is also simple for a developer to change the reporting views when the company needs more data by writing an SQL migration. Beware, exposing a data model to your data lake is similar to exposing a REST API: you will need to publish either backwards compatible changes or make sure you are not breaking the reportings produced with this data source.
Let's extrapolate to a list of imaginary services exposing data with their respective reporting schema as described above:

Fully searchable data through a single reporting database
A very common (and highly advisable) practice is to avoid making reporting requests on your production databases. Indeed, reporting requests can sometimes be resource intensive thus, do try to set up some streaming replication on a dedicated reporting database server for quasi-live data (or set up automated regular dump & restore process if you don't need live data):

Now comes the fun part: we want to offer a single database connection to our data analysts for them not to worry about the underlying complexity. For three main reasons:
- First, because it would be annoying to have multiple databases to manage when it comes to doing data analysis.
- Second, because we want to limit the reporting users privileges so they can only access the
reportingschema. - and last (and maybe the most important), it would be impossible to join data from two different databases.
Our “simple” solution was to use the powerful Foreign Tables possibility offered by PostgreSQL. By using the postgres_fdw module (FDW stands for Foreign Data Wrapper) we can import all tables from a remote schema into a database. We thus import each service reporting foreign schema respectively into a dedicated schema (named after the service name for clarity) inside a single reporting database:

Concretely, here is an example SQL script which we use to set up a FDW for one of those services:
-------------------------------------------------
-- Prepare FDW and list the available services --
-------------------------------------------------
-- Enable postgres_fdw extension
CREATE EXTENSION IF NOT EXISTS postgres_fdw;

-- Create the “foreign” Carriers server
CREATE SERVER IF NOT EXISTS "carriers-service"
  FOREIGN DATA WRAPPER postgres_fdw OPTIONS (
    host '127.0.0.1',
    dbname 'carriers-db-name',
    port '5444',
    -- Our databases being local on the same server
    -- (thanks to streaming replication)
    -- we make sure to tell postgres about it so it can “safely”
    -- delegate cost estimates to the foreign database without
    -- impacting SQL performances
    use_remote_estimate 'true',
    -- guesstimate connection time for a localhost database
    fdw_startup_cost '10',
     -- guesstimate extra cost per-tuple added by the FDW layer
    fdw_tuple_cost '0.0001'
);

-- Create a user mapping to connect to the “foreign”
-- Carriers-Service server
CREATE USER MAPPING IF NOT EXISTS FOR PUBLIC
  SERVER "carriers-service" OPTIONS (
    USER 'carriers-db-user',
    PASSWORD :'carriers_db_password'
  -- the “:” is sql interpolation syntax for psql
  -- you can define variables with “\set foo 'my_value';”
  -- postgresql.org/docs/13/app-psql.html#APP-PSQL-INTERPOLATION
);

-----------------------------------------------
-- Prepare dedicated schema for each service --
-----------------------------------------------

-- Empty any existing objects
DROP SCHEMA IF EXISTS "carriers" CASCADE;

-- Create a dedicated schema which will receive foreign tables
CREATE SCHEMA "carriers";

-- Explicit read privilege for the reporting user
ALTER DEFAULT PRIVILEGES IN SCHEMA "carriers" GRANT
SELECT
    ON TABLES TO "reporting-ro";

---------------------------
-- Import foreign tables --
---------------------------
IMPORT FOREIGN SCHEMA reporting
FROM
    SERVER "carriers-service" INTO "carriers";

-----------------------------------------------------------------
-- Analyse foreign tables                                      --
-- (https://www.postgresql.org/docs/current/postgres-fdw.html) --
--                                                             --
-- Running an `ANALYZE` query after importing foreign tables   --
-- is a good way to update the local statistics of those       --
-- foreign tables. It will help the query planer to run better --
-- queries on foreign tables.                                  --
-----------------------------------------------------------------
DO $$
DECLARE
    tablenames TEXT;
BEGIN
    tablenames := STRING_AGG(
        '"' || foreign_table_schema ||
        '"."' ||
        foreign_table_name || '"', ', '
    )
FROM
    information_schema.foreign_tables;
    EXECUTE 'ANALYZE ' || tablenames;
END;
$$;
This is a first step for our “data lake” to have:
- Data governance, developers can easily adapt the exposed data.
- Traceability, as all data comes directly from the service themselves with streaming replication and no human interaction.
- High quality, or at least as good as the software data quality offers.
- A single
reportingdatabase entrypoint which can be used to query data over multiple services.
Let's ask ourselves a simple reporting question to test this setup: “How many orders of less than 500 € were fulfilled by Parisian carriers?”
SELECT
  COUNT(DISTINCT o.id)
FROM
  expeditions.orders AS o
  LEFT JOIN
    pricing.prices AS p ON p.order_id = o.id
  LEFT JOIN
    carriers.carrier AS c ON c.id = o.carrier_id
WHERE
  p.cents <= 50000
  AND c.city = 'Paris'
And that's all 🎉. Now, we can do a multi-database join on data which was carefully selected to be exposed for our reporting needs.
Curating metrics
Transform the data to your liking
We now have a unique entry-point for all reporting questions. That's a very nice outcome. However we are not quite there yet.
How can we help the data team reason about all the data they have?
How can we help people that don't know the SQL language very well (yet)?
Well, let's simplify the exposed data model and try to offer a layer of abstraction which would be the link between the Software development world and the users consuming reporting dashboards. For that task, we have decided to get the power of SQL views (virtual tables) to the rescue again.
This time SQL views are not used to only “filter out” our data, they are used as definitions in the heart of the reporting DB (thus owned by the Data team) where we can:
- Aggregate our data in a more meaningful reporting model which will be closer to our business analytics.
- Build metrics tables which will serve as a reference for the company's reportings.
- Factorise common data queries to avoid repeating ourselves when querying the reporting database.
- Offer a place where the data team can “lay their eggs” to enrich the original data.
Adding non-SQL related data
What about historic data? What about external data?
When it comes to reporting or analysis we very often have needs coming from many different places. And the places which are producing data are not necessarily the softwares you are building. Indeed your company has priorities and you can't always build “a service” for every single need. That's why your data lake can try to bridge the gap between your software capabilities and your business data.
The non-SQL data we expected to be able to query inside our reporting database came from:
- Historic data (E.g. in our case a MongoDB instance)
- External services (E.g. Pipedrive data)
- (Google) Sheets (Yes, yes I'm sure you have some business metrics stored in some spreadsheets somewhere 😁)
- …
Our trick to handle those? Can you guess? …
Inject all necessary data into dedicated PostgreSQL databases! (Yes, yes, we really love PostgreSQL at Fretlink) By doing so we will be able to transform any non-SQL/external data into a plain old postgres database and reuse the technique described earlier with an extra postgres_fdw connection inside our Reporting database.
This is possible at a small development cost though, because you will need to set up a system which can synchronise those external data sources to a PostgreSQL database. Luckily such a situation is pretty common in the “data” world and many companies try to offer solutions for this problem. One of them is Stitch which is sponsoring an “open-source standard for writing scripts that move data” called singer.io which has many community supported integrations.
With Singer.io the synchronisation phase is split into two parts:
tapswhich extracts source data as streams of data. We've been using mainly:- the
tap-google-sheetstap to extract data from Google Sheets - the
tap-pipedrivetap to extract data from our sales team (which lives in Pipedrive)
- the
targetswhich consumes data streams produces from those taps, to load it into a target database. We only need one:- the
target-postgrestarget to inject data into a PostgreSQL database
- the
Obviously this “synchronisation” process needs to be scheduled on a regular basis (we synchronise such data automatically three times a day, in the morning, at noon and in the evening). It's not as good as the streaming replication for our internal postgres database but it's good enough for our reporting needs.
The result you might ask? A full set of internal data, historic data, external data all available in one reporting database.

Note: if you don't want to handle the synchronisation yourself (I.e. the usage of the tap and target utilities) you can check out Stitch directly which offers an online service to handle everything for you. You can configure your sources and targets via their web interface (Paid service depending on the amount of rows - in millions - you need to synchronise).
Automation in all the steps
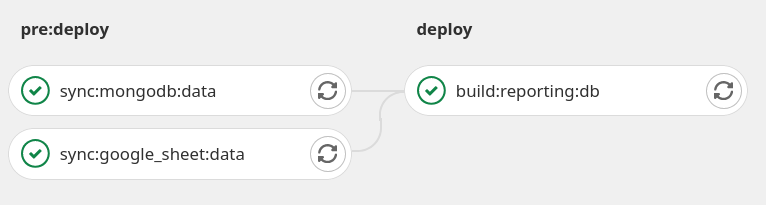
All the machinery we have seen together in this article is made possible thanks to a layer of automation. We orchestrate the whole machinery in a classical continuous delivery pipeline (we use Gitlab-CI) in order to remove any human interactions with the data. The resulting pipeline is pretty simple, divided into two stages:
- a
pre-deploystage which handles all pre-processing / synchronisation of non-standard data (See the “Adding non-SQL related data” paragraph) - a
deploystage which handles the construction of thereportingdatabase
It is our missing part to make the whole “data lake” / “BI tool” / “ETL software” (you name it) a sustainable tool for the whole company. What's important in this pipeline is to make sure to build the reporting database in a stateless way. Meaning we don't need to worry about a recovery plan on the reporting database in case of disaster. Or we don't even need to worry about losing data needed for reporting. Because all the original data is stored in either our services databases or in external services. The rest is just a bunch of SQL scripts which are committed in a git repository and deployed via our continuous delivery pipeline.
If we zoom in the deploy stage, the constructing steps of the reporting database are simply defined in a set of *.sql files. And the result is obtained by executing in sequence:
-
all the administrative steps first, in a directory
db/admin/*.sqlwhich needs to be executed with a privileged postgres user (containing the SQL scripts setting up the FDW and importing the distant schema as described in the “Fully searchable data through a single reporting database” paragraph)REPORTING_DB_URI="$(ADMIN_REPORTING_DB_URI)" ./run-migrations migration_directory=./db/admin -
then all the dedicated metrics and aggregations in an other directory
db/main/*.sqlwhich needs to be executed by the reporting postgres user (containing the SQL scripts shown in the “Transform the data at your liking” paragraph)./run-migrations migration_directory=./db/main
That's pretty much it! The run-migrations script is a dead simple shell script that looks like this:
#!/usr/bin/env bash

set -euo pipefail
shopt -s nullglob

function run_migration {
  local file="$1"

  echo "Running migration $file"

  psql \
    --set ON_ERROR_STOP=on \
    --set ON_ERROR_ROLLBACK=on \
    --echo-errors "$REPORTING_DB_URI" \
    -f "$file"
}

function run_migrations {
  if [[ -z "$1" ]];
  then
    echo "Usage : ./run-migrations.sh MIGRATION_DIRECTORY"
    exit 1
  else
    local directory="$1"

    for file in "$directory"/*.sql
    do
      run_migration "$file"
    done
  fi
}

run_migrations "$1"
Tooling and methods to produce reporting
Now that our “data lake” machinery is ready, let's profit and use it!
Dedicated team responsible for the reporting db
This point seems obvious when you work within a big company which is already well organised. But it's still important to keep it in mind.
Indeed having a team of people that feels responsible for the reporting data produced by your IT systems is essential. It brings:
- Confidence about the quality of the data
- Better understanding of the key business metrics
- Ability to factorise common questions (it happens quite often that two different persons in the company have relatively close questions that can be answered with a common dashboard / graphic)
Remove the wall between developers and data analysts
All the technical setup described above did add a bit of complexity to the whole “data pipeline”. This can't be denied. However it helped to bring different teams a bit closer together.
- Developers felt they had their word on data related matters
- Data analysts got a much better sense of the internals of the developer team's systems
- Non-tech savvy employees could profit directly from the results produced by the data team without having to re-build their own analysis
Try out Metabase as a complete visualisation platform
One last take away of this article is to share with you the “cherry on the cake”. The tool we have been using for the past 18 months to produce visual reporting dashboards: Metabase
Meet the easy, open source way for everyone in your company to ask questions and learn from data.
On top of being an open source software (we ❤ open source at Fretlink), it's a very active project which renders visual reportings very well. It has an interface which is easy to grasp and user friendly. The software allows you to:
- Explore and discover your databases, your tables and available data
- Write “questions” down (it's their term for a request) in two different ways:
- Either with the simple UI editor which can be used by people that are not fluent in SQL
- Or with a normal SQL editor where you can write your questions in plain SQL
- Organise your “questions” into dashboards which offers: filters (which can filter out all questions of a dashboard), embedding into your own apps, revision history, …
The tool quickly became our entrypoint to “consume” reporting data in the company.
Explore data
All the schemas we've set up in the begining of the article (in the “Control the exposed reporting data” paragraph) can be explored via the metabase interface:
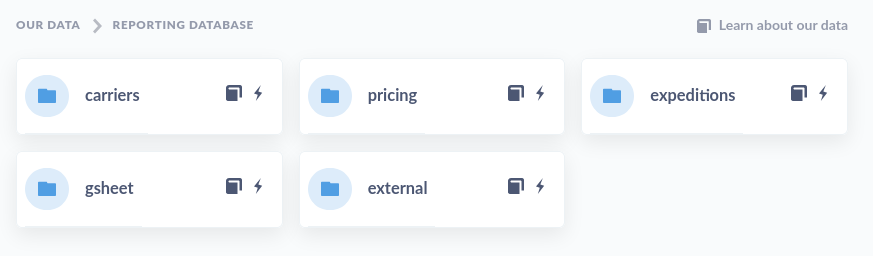
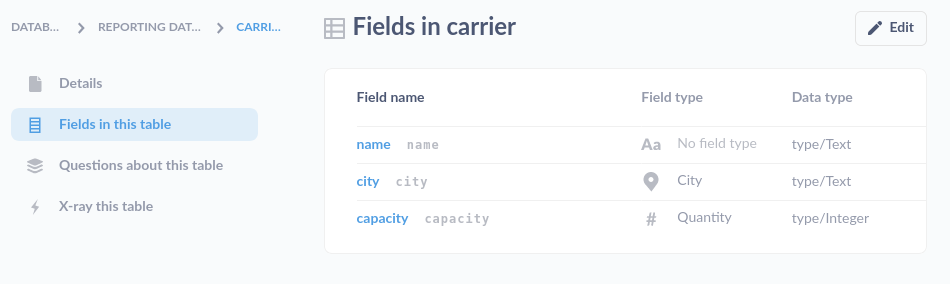
And when you browse down you'll see the list of available tables, then all the way down to the tables' columns:
Write “questions” to query your data
The user friendly editor is a very nice touch. It gives users a visual grasp of how SQL queries are built (without even dealing with the SQL language). This is done with three categories:
- Data:
selectthe columns you needfromone of the data source available from a drop down list- optionally you can
joinwith another data table
- optionally you can
- Filters:
whereyou define optional restrictions on the data you need - Summarize: when you need to
group…the results…bythe columns available in your selected tables and pick a metric you want summarised (count of rows, count of distinct values, cumulative counts, …)

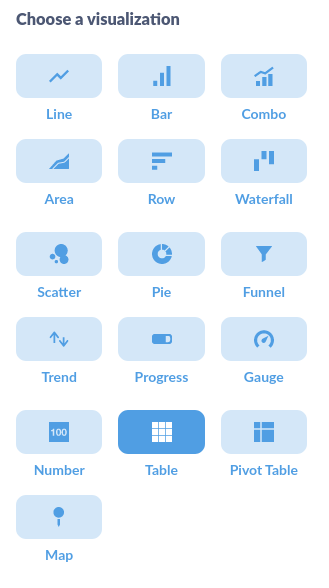
Once you're ready, click the “visualize” button to get a result. Metabase will try to automatically guess the type of visualisation you need (a table, a line graph or a pivot table for instance). But obviously you can change it to select the one you need from this list:
Organise your dashboards
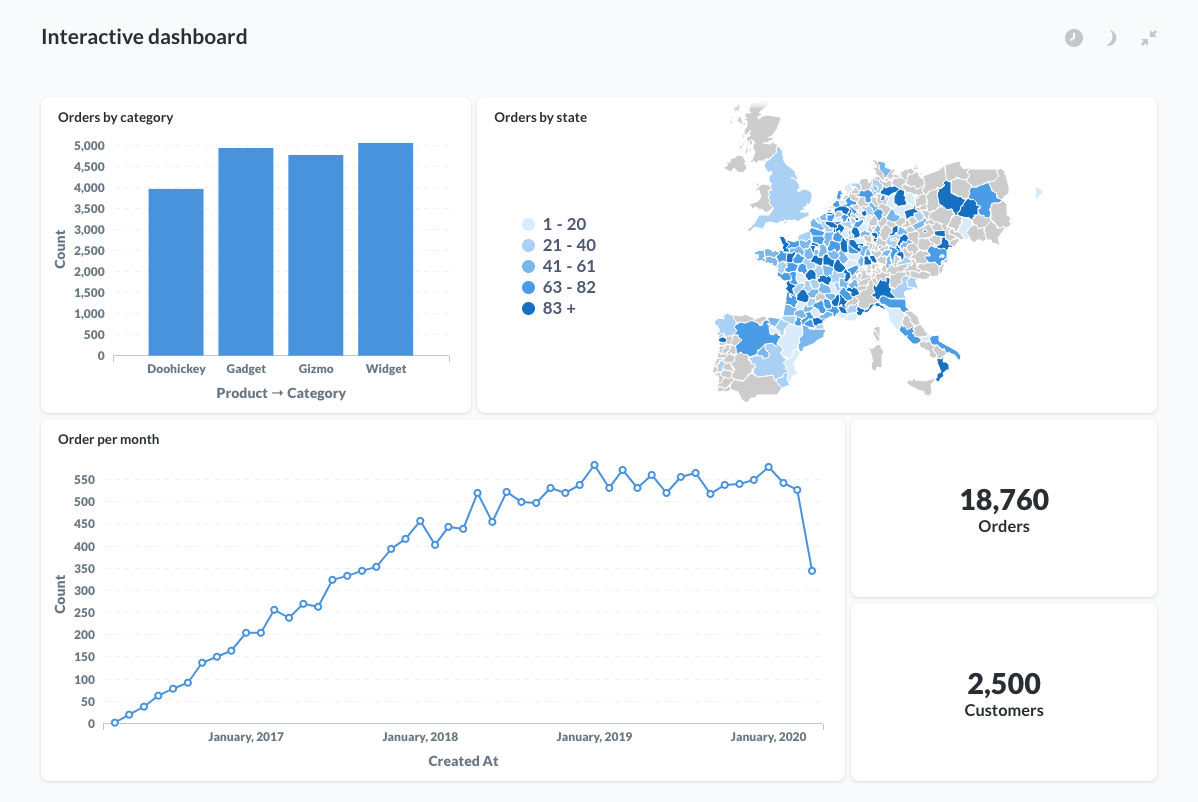
After creating your graphs you'll be able to group them all together within beautiful dashboards. Here's a example dashboard taken from the Metabase documentation:
The nice touch is the ability to embed dashboards in your own applications. (⚠️ no paid licence is required for a back-office integration but you will need to pay the Commercial licence if you want to embed dashboards in the products you sell)
If you wonder how to concretly embed a dashboard, you can check out the small tutorial provided by Clever-Cloud which explains it well: “Integrate Metabase in Ruby on Rails” (or any other web application)
TL;DR
Technically, we were happy to offer a relatively simple solution to work with data. Indeed, managing a PostgreSQL database is relatively easy (and we have experience with it) and we solved all the problems we originally had by using only quality open-source software. The mix of Postgresql taking care of the data, Gitlab-CI as our automation pipeline and Metabase displaying beautiful graphs for the end users is really something we would recommend.
This full PostgreSQL choice obviously came with a non-negligeable cost which was to teach advanced SQL to some of our data team colleagues. We tried to take the time to do so as we felt it was important to share knowledge accross our teams. As of today, the result is good, our data team is confident to produce quality dashboards for the company, and conversely the company trusts the produced data visualisations.
To conclude, I'll paraphrase a good article from the ManoMano tech blog (“Is being too data-driven dangerous?”) which sums up well the key goals of what we tried to achieve with our own data machinery migration:
- Demand high quality data (via traceable data sources and data governance)
- Select metrics that really matter to your question (what are you trying to solve?)
- Empower your company with methodologies, tools and a data team they can lean on for data related needs
- “resort to business sense to make a decision, use data to inform them”
Have fun, stay free and stay kind.
✨